SQL Azure is a very interesting service. It’s as interesting as it is misunderstood both in terms of how exactly it works, and what it’s intended to be used for.
First of all, it’s not really the same thing as SQL Server that you install on your box, virtual or physical. It certainly provides the same functionality, and from functional perspective most of things you can do with SQL Server, you can do with SQL Azure. But it behaves in so many different ways that you can’t truly compare them side by side.
Another thing is what SQL Azure was designed for. It’s designed for massive cloud workloads where concurrency is more important than sheer speed. And in that respect it is just brilliant. However, to get most out of it, you have to write and optimize your database access code specifically to take advantage of its features and behavior, otherwise, you simply get performance that can be qualified as mediocre at best.
What happens when you put NAV on SQL Azure? Well, that’s something that you certainly can do – Microsoft does it as well. The thing is – it works. It leaves a bit to be desired if you intend to run heavy processing, but my firm conviction – having tested it and having gone medieval on it with my tests.
Let’s take a look.
First, a disclaimer. You can’t compare the results I got with these tests with those that I got with either on-prem or VM configurations. Most of the tests with SQL Azure ran up to 20 times fewer iterations.
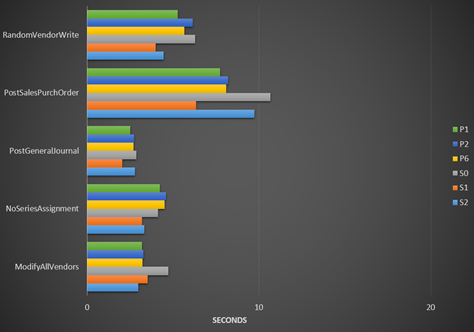
Let’s first take a look at business processes:
First thing that you can notice here is that P (Premium) tiers do not necessarily show better performance than S (Standard) tiers.
How come?
The tiers of SQL Azure are primarily around managing resources. SQL Azure constantly monitors the usage of your database, and (de)allocates necessary resources as it notices the increase or decrease in activity.
While different tiers differ in a number of ways between each other, there is only one metric in there that’s truly relevant for the tests I ran today: DTUs. In effect, they define how many transactions per second can a database perform.
Let’s take a look at the numbers:
- S0: 10 DTUs
- S1: 20 DTUs
- S2: 50 DTU2
- P1: 125 DTUs
- P2: 250 DTU2
- P6: 1,000 DTUs
- P11: 1,750 DTUs
Good, then the more you get, the faster it should perform, right?
Wrong.. Very wrong.
I am so very sorry that I haven’t taken any screenshots of the DTU charts, which Azure Management Portal shows you for each database, because those charts would explain why DTUs do not necessarily mean higher performance.
If you have a task that SQL can do on its own, without much asking NST back and forth, the more DTUs it can perform, the faster the overall performance will be, but the point is – with NAV – there are very few of those operations, and there was very little data involved in the tests to actually benefit from many DTUs. Since NST performance and network latency play a major role, it may very well be that SQL Azure doesn’t ever get to utilize all the vast DTUs allocated to it, and that’s why performance chart above does not correspond even remotely to the price tags attached to different tiers.
What’s most obvious from these tests here is that as far as the business logic goes, if you don’t expect high concurrency levels per database, S1 tier is the one to go for. For small deployments of a couple of users per tenant, I believe that S1 is going to provide all the performance you need.
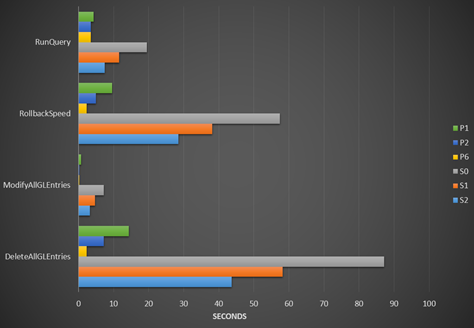
Let’s now take a look at pure SQL performance, those situations where
Now we are talking business. When you give a big task to SQL, one where it doesn’t have to come back to NST to ask report on progress or ask for more information, those magic DTUs shine prominently.
With S0, my database was struggling. At 10 DTUs it was really difficult for it to keep up and that’s why in all these tests, the S0 is almost consistently the slowest. The utilization chart was very consistent at 100% for the duration of the test.
With S1, the database was not struggling. While DTU utilization was still mostly around 99% it had occasional falls under it.
With S2, there were obvious peaks for more intensive tests, but overall it never struggled for resources.
With P tiers, there were occasional peaks towards 40%, and a very rare one at 70%. At P6 it was running mostly under 30%, while at P11 (not shown here) peaks were at 4%.
What’s most obvious here is that sheer SQL performance is entirely consistent and proportional to the price you pay. It performs exactly as it says on the tin, and that’s the beaut of SQL Azure.
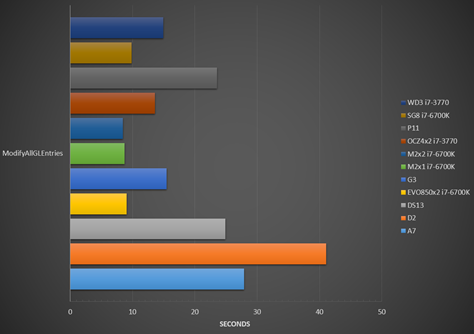
This ModifyAllGLEntries test is tests probably the single most efficient SQL bulk operation – modification of a value on a non-indexed field in all rows in a table. It requires no re-paging, no restructuring, it simply goes over data and writes a new value.
To put P-tier performance in perspective, take a look at this:
Some of these are the finest disks the money can buy today, running on systems with not many limitations on what you could compare to SQL Azure DTUs. Here, the P11 tier at 1,750 DTUs shows just how fast that is, and how well SQL Azure performs when you let it do what it does the best.
However, as I said, your application has to be written specifically for it to take advantage of it the best possible way. Unfortunately, though, NAV is not really optimized for SQL Azure.
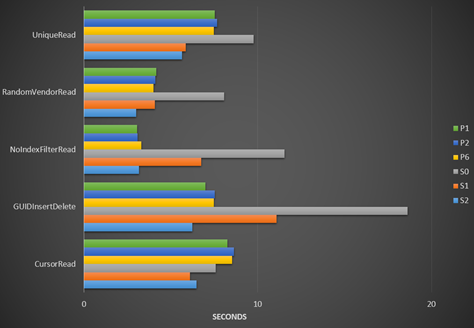
Let’s take a look at the crazy tests, those that push any SQL to its limits.
Interestingly enough, the performance of SQL Azure is much more consistent with these tests than with any other type of configuration. Why is it so?
First, it’s again because of DTUs. The more you have, the more work it can do – no matter how crazy the work gets.
And this shows, especially with S tiers where with limited DTUs available, all three sizes were pushed way over the edge, except when simulating cursors, where again DTUs were not the most critical resource, and where latency proved to be more significant.
Conclusion
Testing pure performance of SQL Azure may seem pointless. And it is. SQL Azure is designed for vertical scalability and concurrency, and testing it in single-user mode doesn’t show much, except for the fact that it wasn’t really designed for single-user mode.
While the numbers here may seem so much inferior to SQL Server on Azure VM and then even more inferior to on-prem bare metal performance, they aren’t all that bad. It’s like comparing a Toyota to a Lamborghini and asking which one is better. Lamborghini is faster, alright, but not necessarily better, and in most situations you don’t really need all that horsepower.
I don’t conclude my work on performance testing here. There will be one more post where I’ll show some other relevant numbers I can draw from my test results, that will enable you to compare and measure performance and be able to size your configurations to a reasonable extent.
And something that I now definitely want to do much more desperately than ever before is to test concurrency – how many requests can each different configuration efficiently handle before going belly-up.
So, stay tuned for more performance information, and for now, well… I think it’s time to call it a day.


Pingback: NAV performance part 4: SQL Azure - Vjeko.com - Dynamics NAV Users - DUG