Not that I am saying it’s a good thing, but trial and error is a fairly common approach to debugging in the NAV world. We’ve all done it. Heck, even with the comprehensive testability framework built in, we all still do it more often than we’re happy to admit while sober.
But the overlord of trial and error in NAV is development of control add-ins in JavaScript. JavaScript itself is making it difficult in the first place, and then integration with NAV makes it even harder.
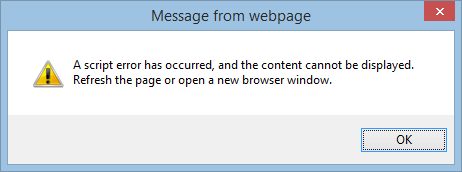
There is one situation in particular that’s adding a cherry on top of all of problems, and it’s the creepy “A script error has occurred” error message. It’s the equivalent of the BSoD.
This is what it looks like:
And if you’ve ever experienced it, you’ll know how to appreciate the near-futility of anything that ensues.
First of all: refreshing the page or opening a new browser window – even though the error message suggests exactly that – often won’t really help at all.
Insanity: doing the same thing over and over again and expecting different results. (Albert Einstein)
So, let me explain exactly why and this error happens. You will see this error message if an unhandled JavaScript error occurs in a function call invoked from C/AL. And with all the JavaScript frameworks out there, this can really be caused by absolutely anything and its sister. Even though, in theory, it’s fairly easy to get to the heart (or, perhaps, some other organ) of the problem, it’s amazing that when this error happens, you have no clue as to why or where in JavaScript code it happened. A perfect example of an improperly handled unhandled error.
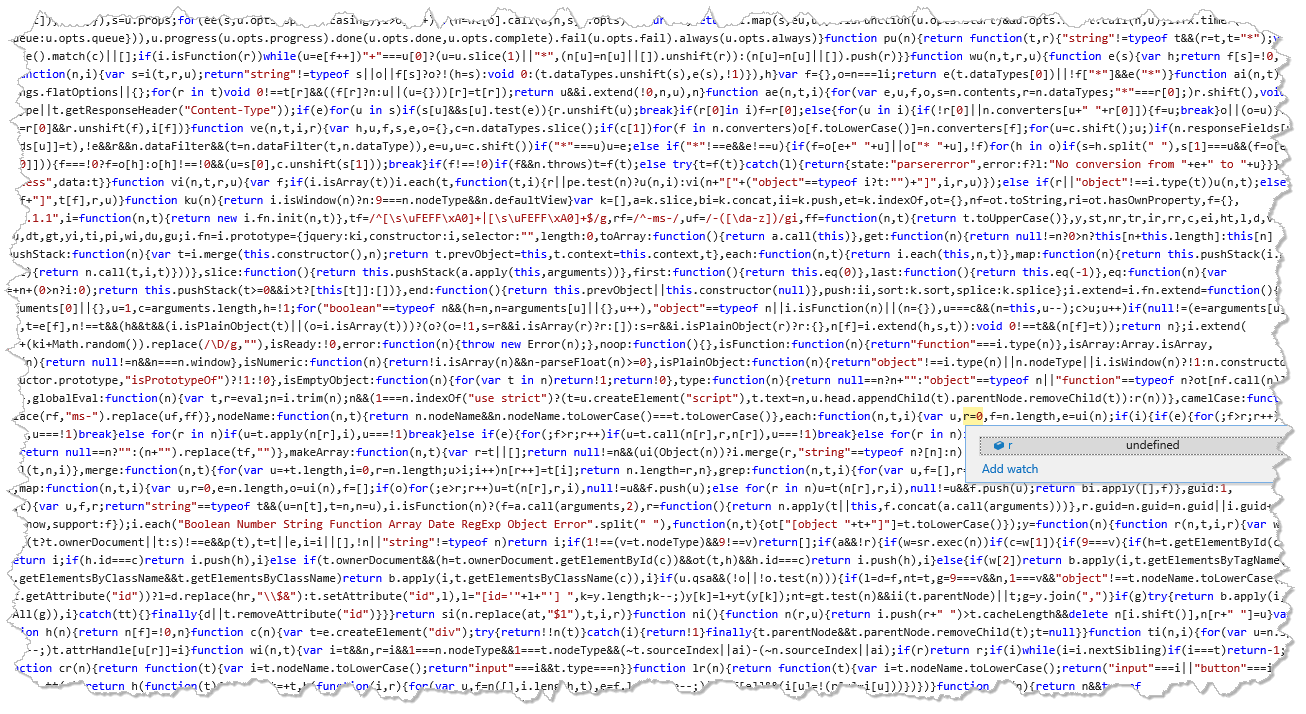
So, to help you avoid debugging through mountains of minified JavaScript gobbledygook that looks as Klingon to you as it does to me:
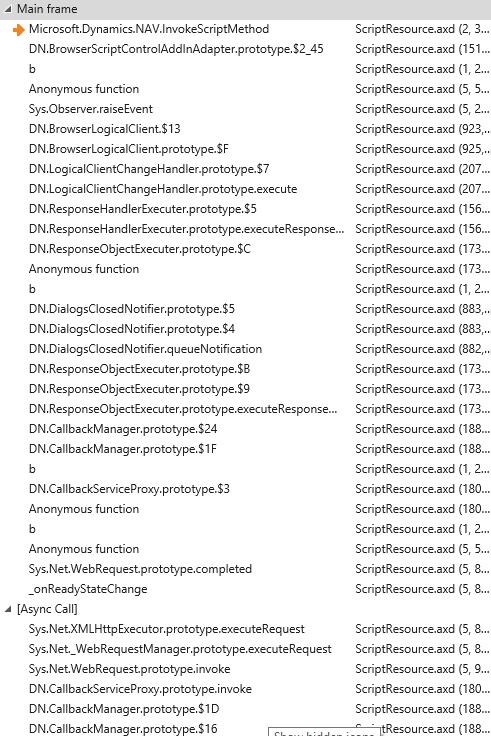
… through call stacks that, just like politicians in Croatia, say a lot, but nothing at all:
… here’s a life saving hack for you.
Somewhere – the closer to the top, the better – in your JavaScript, add the following piece of code:
window.__controlAddInError__NAV = window.__controlAddInError;
window.__controlAddInError = function (e) {
    console.log("Unhandled error has occurred: '" + e.message + "' - Stack: " + e.stack);
    window.__controlAddInError__NAV(e);
};
You will still see the same “A script error…” error, but you keep all of its Freddy Kruger charm at bay, because this time, in the browser console window (hint: F12), it leaves a precious piece of information:
And now you know what, why, and where happened.
So, for all non-JavaScript folks, let me explain the mechanics of this. How exactly does this work?
First, the NAV JavaScript framework adds a lot of functionality to the runtime, one of those being the __controlAddInError function that’s called every time an uncaught error happens inside of a C/AL method call to the JavaScript control add-in.
Now, in JavaScript, every function is also a variable, and I first obtain the reference to the function and store it in my __controlAddInError__NAV variable. I do this on the window object to help you avoid scoping issues in case you decide to paste this inside a function call in your code.
Then, I supplant my own function in place of the original __controlAddInError. The NAV extensibility framework has no way of knowing I did so, so it happily calls my function instead of its own.
My function logs the necessary information from the JavaScript Error object, and then calls the original function to do whatever else (apart from showing the meaningless message) it needs to do.
And that’s all.


Hi Vjeko,
It was good to meet you and the guys in reading.
Great article this will help me a lot I had been pondering about making a debug mode for all my control add-ins.
If you ever come across an issue that only effects the windows client which you can’t reproduce in the web client use the statement ‘debugger;’ into your Javascript this will fire Visual Studios just in time debbuger and you will be able to attach your visual studio project and step through the code and use the instant window to execute any JavaScript you are suspicious about.
Hope this is also helpful.
Cheers,
Jamie.
Hi James,
It was good meeting you too. Thanks for sharing this tip – it’s something that I regularly do. However, you don’t need Visual Studio for that, you just press F12 in the browser, and adding ‘debugger;’ will start the debugger as well. I wish something like this was possible in Safari on iOS, that didn’t require me to use a Mac 🙂
Ha, must be some morphic resonance going on. I also just blogged about this tip and a nice way of calling it from NAV. https://geeknikolai.wordpress.com/2015/07/17/debugging-dynamics-nav-javascript-control-add-ins/
Or simply F12 in internet explorer and select the debugger ???? issue though is that it’ll break in all kinds of standard NAV Web Client errors too (which seem to be there on purpose ????) but really like your solution though ???? makes life somewhat easier ????
Pingback: Capturing unhandled errors in JavaScript Control Add-ins – 7/23, Navigate Into Success |